Win work. Deliver it. All in one place.
Create Value is the surface inside Nynch where a relationship turns into revenue. Pipeline as an Orbit, personalised outreach, meeting intelligence, deal rooms, client cockpits, embedded coaching, and a quantified trust score. The work that pays you, organised around how the work actually happens.
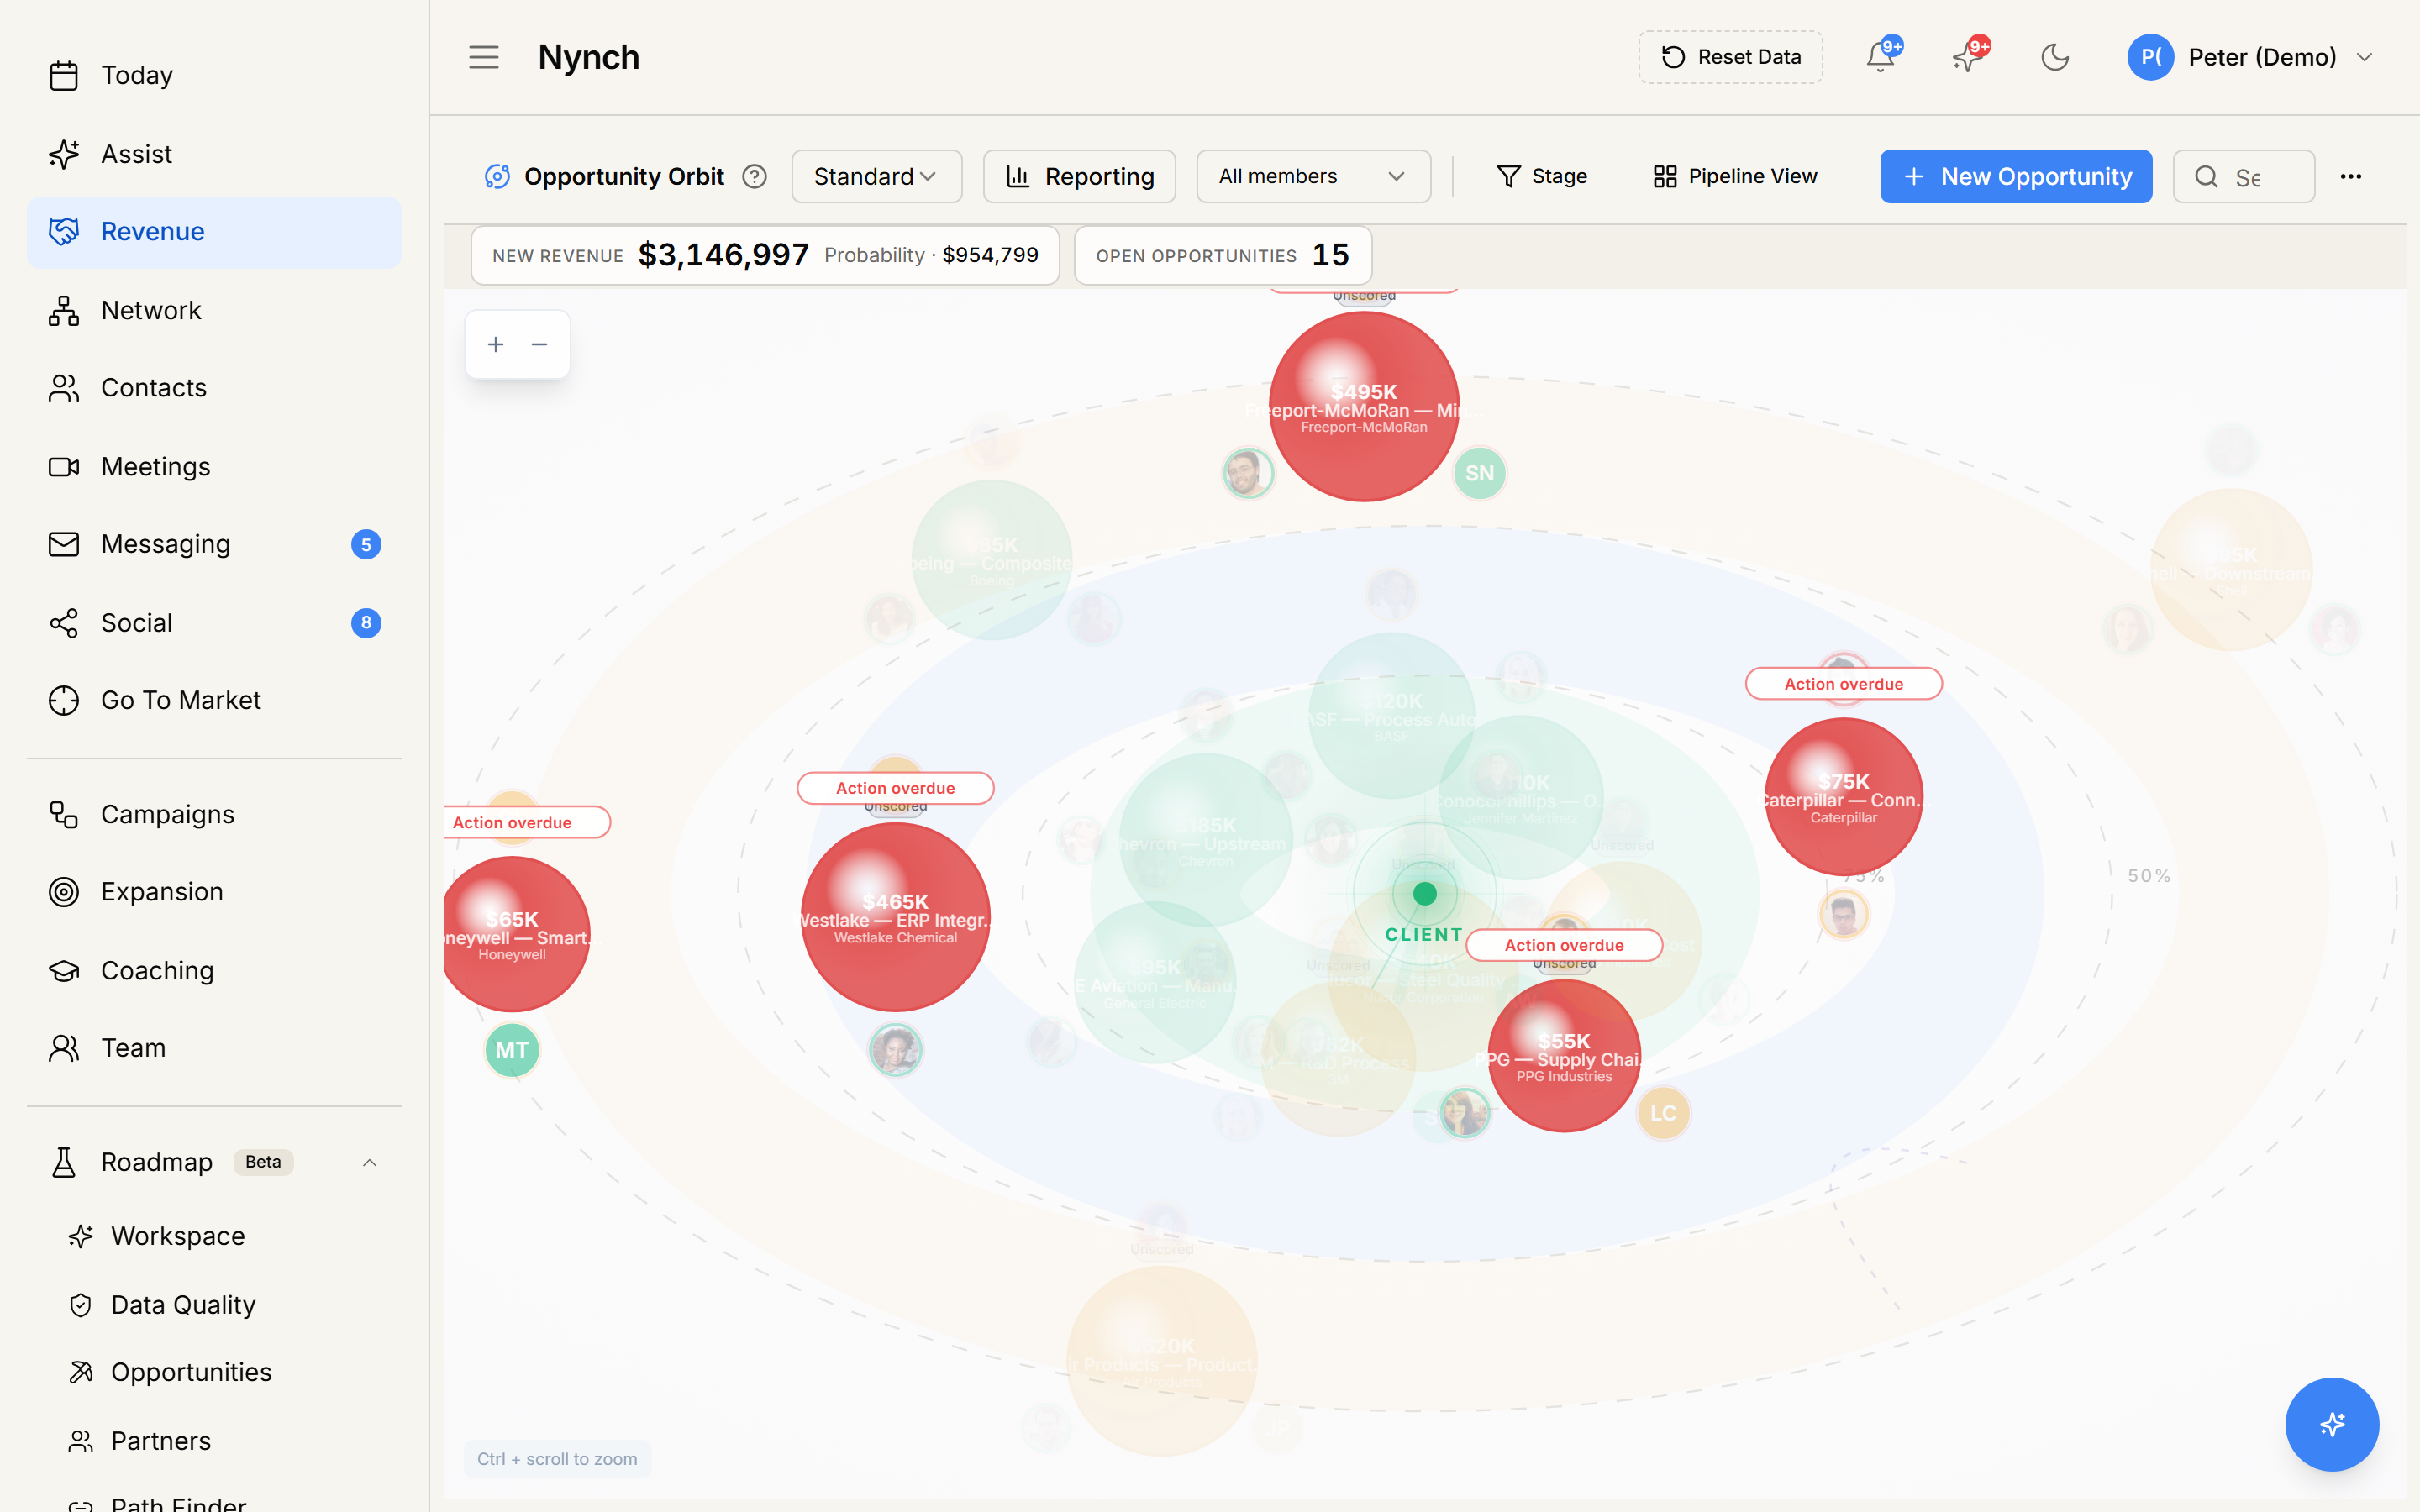
Currency, probability, every open deal in one canvas. £3.1M of revenue in motion, fifteen opportunities open, the four red bubbles needing attention this week.
Funnels assume linear motion. Real deals don’t.
The kanban board with stage columns is fine for SDR-led pipelines where deals move predictably left to right. Consulting and agency deals don’t. A deal can sit in qualification for six months, then close in four weeks once the right stakeholder unlocks. Stage tells you almost nothing.
What matters in relationship-led work is closeness to close, measured in time, not in stage progression. Opportunity Orbit visualises that directly. Distance from centre is months to close. Inner ring is the next 30 days. Outer ring is six months out. The shape of your pipeline becomes obvious at a glance.

What you actually see.
Deals closing this quarter
The deals you’re actively working to close. Bigger circles for higher-value deals. Colour intensity for higher win probability. The shape of the inner orbit tells you whether the quarter is concentrated or thin.
Pipeline depth
Mid and long-horizon deals on the outer rings. The depth of these orbits forecasts the next two quarters. A thin outer orbit today is the warning of a thin pipeline three months from now.
Prospects in ambient view
People in your network matching your ICP who could become deals. They brighten when signals strengthen, job change, hiring, content engagement. When you start a deal with one, they move into the orbital rings.
Two views, one pipeline.
Kanban (board view) is still there. The two views show the same deals in different visual structures: kanban for stage progression, Orbit for closeness and relationship density. Most consultants use kanban as the daily working view and Orbit for weekly review, monthly forecasting, and stakeholder updates.
Daily operations
Move cards through stages. Working view. Best for quick stage updates and per-deal action focus.
Weekly review & forecasting
Whole-pipeline shape. Best for spotting concentration risk, gaps in the next quarter, and pipeline depth issues before they bite.
Same data, switchable
One click between views. Same deals, same numbers. Different question being answered. Use whichever fits the moment.
What sits inside Create Value.
The Opportunity Orbit above is the pipeline view, but Create Value covers the whole win-and-deliver loop. Each surface below is its own deep-dive.
Personalised Communication
One-to-one outreach written from the relationship history Nynch already holds, not a template. Drafts queued in the morning briefing for one-click approval.
Meeting Intelligence
Pre-meeting briefings, in-meeting capture, and post-meeting commitments extracted automatically. The deal moves forward without anyone writing notes.
Deal Rooms
Per-deal microsites that surface the right case studies, methodology overlays, and stakeholder briefs. Buyers see a working space, not a static deck.
Client Cockpit
The post-win view. Cadence health, commitments tracked, account expansion signals, and renewal risk flagged before the client feels it.
Coaching
An always-on coach inside every deal. Surfaces the stakeholder you have not engaged, the next-best action, and the methodology checkpoint you skipped.
Say/Do Ratio
Every promise you make in a call or email tracked automatically. Your trust score, made measurable. Falls before clients notice, and you can act before they do.
For relationship-led businesses.
Quarter shape, not column count
You don’t care if a deal is in “Discovery” or “Proposal”. You care whether it’s a 30-day deal or a 6-month deal. The Orbit answers that immediately.
One pipeline across portfolios
Your fractional engagements all generate deals. The Orbit aggregates them into one view filtered by portfolio, the only place your full forward book is visible at once.
The shape of the agency’s next year
Agency principals describe the Orbit as the first pipeline view that matches how they actually think about the agency’s forward book. Concentrated near term + thin long term = a problem visible in seconds.
See Create Value on your real pipeline.
Book a 30-minute walkthrough. We’ll plot a sample of your active deals into an Orbit live and show you what your quarter, the two quarters after it, and the delivery loop behind your top accounts actually look like.